3D Colour Space
What does a colour system look like in 3D?This window shows the colour systems in 3D CIELAB coordinate system. It is possible to navigate therein and to select individual colours. Also the harmony of the colours or the chosen colour scale (e. g. the redscale, greenscale and much more) can be displayed.
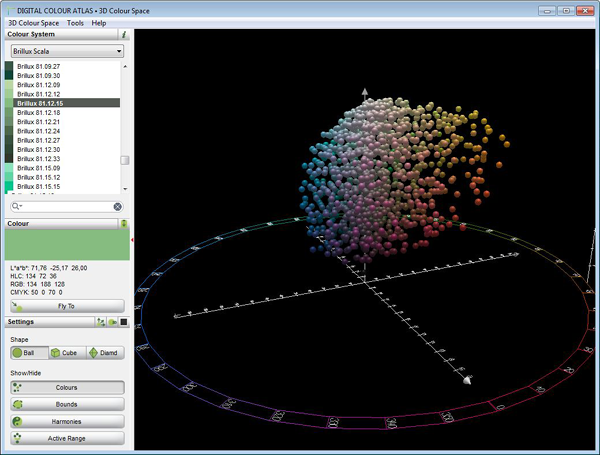
Interesting insight: a colour system in 3D-colour space.
Brief Instruction
- Choose a colour system. You can see the colour system on the right side in 3D.
- Choose a colour. The chosen colour is selected in red.
- With "Fly to colour" the chosen colour is accessed.
You can navigate the 3D colour space:
| Input | Function |
|---|---|
| mouse wheel or Alt + mouse move with pressed left mouse button | colour space magnifyer |
| mouse move with pressed left mouse button | results in a turn of the colour space |
| SHIFT + mouse move | results in a scrolling of the active window |
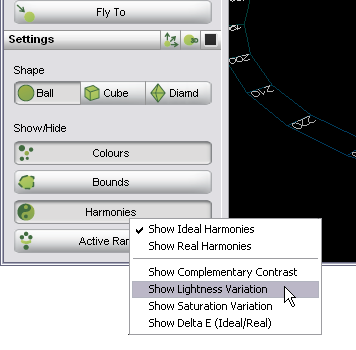
Show Colour Harmonies
If the "Harmony" button is activated, the harmonies in the window "Harmony" will show. The design of the screen is dependant on the setting of the „right-click“ menu of the colour symphony buttons.
| Setting | Function |
|---|---|
| Show Ideal Harmonies | A regular polygon with n edges on an intensity level is displayed for the complementary contrast and for the change of the intensity a equally partitioned vertical line. An equally partitioned horizontal line is displayed for the variation of the saturation. n equates the corresponding number of levels. |
| Show Real Harmonies | The nearest colour of the colour system is displayed for every dot/point of the ideal harmonies. |
| Show Complementary Contrast | The complementary contrast appears as a regular polygon with n edges on an intensity level and/or the corresponding system colours. |
| Show Lightness Variation | The change of the lightness is shown as a vertical line and/or with its associated system colours. |
| Show Saturation Variation | The saturation variation is displayed as a horizontal line and/or the associated system colours. |
| Show ∆E | A connecting line between the dots of a polygon and the respective nearest real colours of the systems is displayed. Their length corresponds with ∆E (according to Hunter). |
Making Visible the Borders of a Colour System
This function shows directly at the first glimpse, which parts of the CIELAB colour area completes a system and where gaps maybe. The colour area has been divided to 8 intensity-, 36 hue– and 12 saturation levels. If within one of these sections one or more colours are used this part will be displayed.
The borders can be displayed with the window „3D colour area options“ in their corresponding lab colour (Full colour), as wire frame or as border points. Advantage with the wire frame: The colours remain visible, the speed of calculation is also good even having large coulour systems.
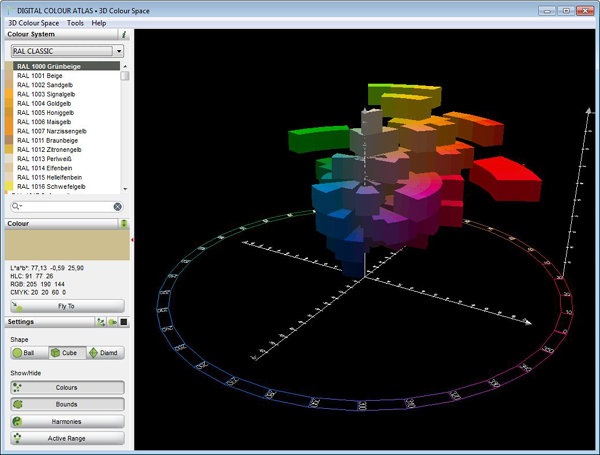
In which areas is a colour system under underrepresented? Here we will see it on the first glimpse.
Settings
The settings for the display can be made in the main windows on the left lower side.
| Setting | Function |
|---|---|
| Form: cube, ball or octahedron | Attention: The form of the "ball" requires far more calculating capacity which is clearly noticeable for large colour systems! |
| Show/hide: "Colours" | The colours of the corresponding systems are displayed here. Only colours are displayed which are within the area which has been chosen in the window „colour area“. |
| Show/hide: "Harmonies" | The colour harmonies which have been chosen and set in the window „Harmony" are displayed in an idealistic way (CIELAB) or with the real system colours (or both). |
| Show/hide: "Bounds" | It is displayed here in which extent a colour system covers the CIELAB-colour area. The colour area is divided in numerous sections. If in one of these sections at least one clour tonality is included this part will be displayed. |
Further settings can be made by using the menu option „3D Colour Area Options“.
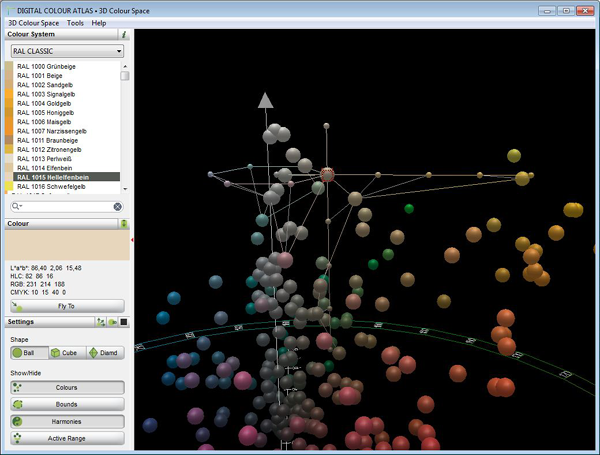
Display ideally typical harmonies (complementary contrast, brightness variation, saturation variation) for an input colour.
About the CIELAB Colour Area
Without addressing the issue of the fundamentals and the complicated formulas, it can be stated that CIELAB is the up-to-date calculable colour model which is mostly complying with our visual perception. By that reason the CIELAB colour area is today's industrial standard in measurement of colours and recipes. It is also common within standard software with the operating systems „Windows“ or on the Macintosh platform, e.g. it is possible to enter Lab-colour values in Coreldraw, Photoshop or Indesign.
In the 3D colour area we can see the three dimensional LAB coordinate system. Within that system every colour is labeled by a unique position on the three axes.
If one now transforms the rectangular coordinates L, a and b to the corresponding polar coordinates one gets values for angles, height and distance from the center axis. This can be displayed in a very descriptive way:
- Kind of colour or Hue (H): We can find the fundamental colours in the circular coordinate system. Colours of a specific angle have the same fundamental colour (e. g. orange, hue = 85).
- Brightness or lightness (L): How higher the value of a colour is how brighter it is. At the level of 100 it would be absolutely white, at 0 it would be even more black than pitch black.
- Colourfulness, saturation or chrome (C): The farther a colour is from the „0“ level the more intensive is it the stronger saturated is it.
Of course „black“ can just have a colour saturation as little as „white“. Therefore the CIELAB colour body ends up and low in one singular point.
Colour Systems in the CIELAB Colour Area
Every colour system covers a more or less marginal fraction of the CIELAB colour area. As far as a colour area reaches to the exterior is dependant on the used pigment. In general the highest saturation is reached within the orange scale. The coloured pigments are also regularly formed in the area of the largest saturation, due to the fact that e.g. yellow pigments are brighter than blue pigments.
One can see at the first glimpse where a colour system has gaps or clusters. Mostly impressive is the presentation of the CIELAB system.
3D – The Future
At the beginning the 3D colour area offers for the practical work of architects, painters or people involved in printing only few starting points. It is an outstanding tool for being introduced to colour therory and systematic in a descriptive way as well as to perceive the strengthes, weaknesses and opportunity of the colour systems in a clear and fast way. One also sees the theories for colour symphonies at one glance or immediately recognizes gaps and accumulations (also the opportunities) of the colour systems.
Furthermore we are convinced that you will get a view to the future of the use of colours with the 3D colour area. It is expected that due to the increasing calculation capacity in more and more programmes the selection of colours will be made with a method similar to our programme. This is not only quite simple after being familiarized with the system but on gets a much better overview also of the larger systems, recognizes the opportunities is able to search for correlations, to directly perceive symphonies and much more.
The opportunities of vivid planning of colours are not long fully used with this window. For example it would be thinkable to convert the 3D windows to a colour choice menu of a main application as well as to implement further harmony algorithms, which are reflecting further aspects of our perception and emotional world (e.g. logarithmic increase, screw motions through the colour area,...). Because: Colour is nothing else than a feeling.